ETA (September 13,2018): If you got here from the SCBWI PRO Insider newsletter, this post lists all of the posts with results related to our survey.
On March 15, 2018, Jeanette Bradley and I launched an anonymous, online survey with the goal of collecting data about author and illustrator compensation for school visits. (Sometimes called author visits). There are many aspects we could have chosen to investigate, but we needed to keep the survey focused so that people would fill it out, and we would be able to crunch the numbers and make sense of the data (This is a volunteer effort, after all).
Therefore, we limited this survey to residents of the U. S. who have at least one book published. It’s not that we didn’t want to go wider. We simply couldn't manage that much data.
You may wonder why Jeanette and I are the ones who ran this survey. I first had the idea to do this because I care deeply about school visits. I facilitate workshops to help authors and illustrators develop engaging school visit programs. One question I face in every workshop is “How much should I charge for school visits?” Or the even more troubling, “Wait. I should be paid for school visits?” Over and over again, I’ve stressed that authors and illustrators should be compensated fairly for their time. Yet, what is the “going rate?” What is fair?
I asked Jeanette Bradley to partner with me on this survey because her first career was as a policy researcher focused on studying housing and lending discrimination. She has experience writing and analyzing surveys about sensitive topics. This survey would not have been possible without Jeanette's expertise. Angie Isaacs, another KidLit person with advanced statistics experience also reviewed our results before we published them. Ultimately, however, Jeanette and I are responsible for the final reports, so any mistakes sit with us.
Summary of Important details:
Respondents had to be residents of the U. S.
Respondents must have at least one book published, either traditionally or indie/self-published.
Respondents must have done at least one school visit in the U.S. in the past year
All data was kept anonymous. No identifying information was collected, and the results are being reported in aggregate format.
To solicit survey respondents, we shared the original blogpost that launched the survey in various places on-line:
Our personal pages on Facebook.
Various KidLit groups and pages on Facebook (e.g. KidLit 411, Picture Book 12x12, Create Engaging School Visits, the KidLit Women community page and private group).
Twitter. (We used the following hashtags to get more attention: #KidLitWomen, #KidLit, #MGLit, #YALit, #KidLitArt, and asked people to share/ retweeet widely).
Several SCBWI email groups/listservs.
The Authors Guild social media channels.
Thank you to everyone who took the time to complete our survey. We appreciate your time and honesty. In addition, many people wrote extensive comments about their experiences when given space to do so. We’ll try to cover the depth and breadth of experiences by sharing selected comments within our posts.
A note about gender, race, and ethnicity
People are subtle, complex, and multifaceted. Surveys are blunt instruments for measuring the breadth of human identity and experience. We recognize that gender is not binary, and neither is race/ethnicity. However, given the size of our survey, we have split our data into two categories on both of these identity variables, in order to protect the privacy of survey respondents.
Gender
We asked survey respondents to self-identify as one of these gender categories: male, female, non-binary, or a write-in “other” category. About one percent of respondents identified as non-binary; no respondents chose the write-in “other” category. Because there are a small number of respondents in the non-binary category, and we want to protect the privacy of respondents, we were faced with two choices. We needed to either exclude the non-binary respondents from the survey analysis, or we needed to combine them with a gender category that contained more responses.
We chose to combine the non-binary respondents with the respondents who identified as female, because we felt it was better to keep their data in the survey and identify what we had done than to erase a category of people from the survey. We combined non-binary respondents with female, rather than male, respondents, under the theory that they are both groups that experience systemic discrimination.
Race and ethnicity
We asked respondents to identify themselves with as many of the following race/ethnicity categories which they felt applied: American Indian or Alaskan Native, Asian or Pacific Islander, Black or African American, Hispanic or Latino, White / Caucasian, Other (please specify). Because some racial categories had only a handful of respondents, we chose to combine everyone who identified themselves as American Indian or Alaskan Native, Asian or Pacific Islander, Black or African American, Hispanic or Latino, as more than one category, or who wrote in that they identified as mixed-race, as a Person of Color or POC. (Note that respondents who wrote in that they were, for example, “Scotch-Irish” or “Ashkenazi Jewish” were coded as white). We realize this does not capture the rich complexity of racial and ethnic identity, but it is a small survey, intended to look at the general picture, and our goal is to protect the privacy of respondents while describing sensitive information.
Respondents: 419 authors and illustrators
Our results are based on the 419 respondents who had done at least one author or illustrator school visit in the last year who filled out our survey.

Three-quarters of respondents were female, which is similar to the demographics of the children’s literature industry as a whole.
1 percent of respondents identified themselves as non-binary. With so few respondents in this category, it would be easy for someone to trace specific answers to individual respondents, so we have grouped the non-binary respondents with female respondents in our results.

Respondents live in all regions of the United States, with 39% of them hailing from the Northeast.

89 percent of respondents identified as white.
11 percent identified as either American Indian or Alaskan Native, Asian or Pacific Islander, Black or African American, Hispanic or Latino, or some combination of multiple racial/ethnic identities.
This is similar to the 14 percent of children’s book authors who were identified as people of color by the CCBC count in 2017.

To protect the privacy of our survey respondents, we have grouped all people who reported that they were mixed-race/ethnicity or were a person of color together into one category.
We know from research by the Cooperative Children’s Book Center’s (CCBC) annual count that authors of color are underrepresented in children’s literature. But because of the number of respondents in this survey, and the fact that it deals with sensitive topics, we wanted to err on the side of caution in reporting survey results. (Again, some categories had only a few people who responded).
Most respondents are writers
81 percent of our survey respondents are authors.
17 percent are author/illustrators.
Only 2 percent are illustrators. This may be because illustrators do fewer school visits, or it may have to do with the places where our survey was shared. While we cannot know who exactly saw the survey promoted, it's possible we mostly reached writers.

Survey respondents write across the breadth of children’s publishing. Many write for more multiple age groups, some write both fiction and nonfiction. Others noted that they are also poets or have published adult novels.
Respondents hail from all career stages. It is difficult to capture an author’s career in one metric, but here we simply use the number of traditionally published books.
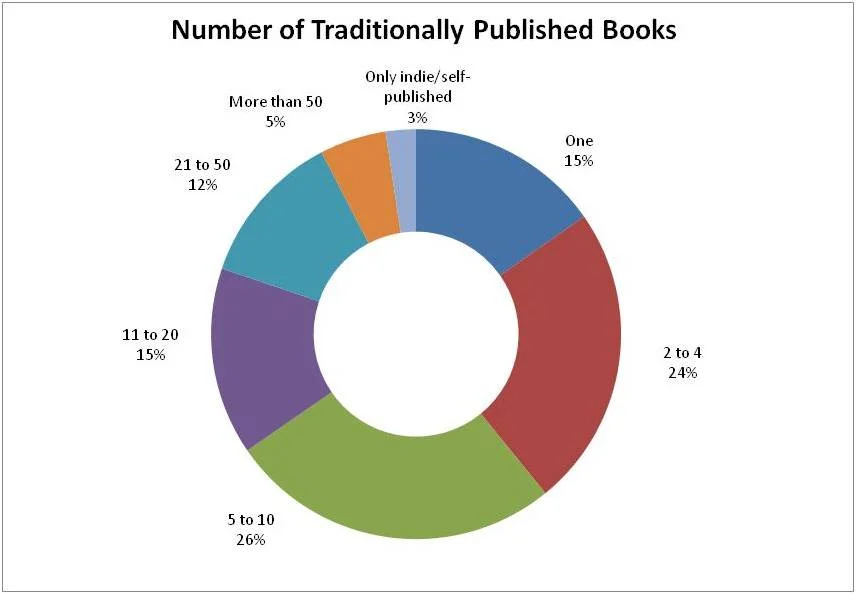
3 percent of respondents have no traditionally published books, and have solely self- or indie-published. We felt that it was important to include these respondents in the survey results, as this is a growing part of the publishing landscape.
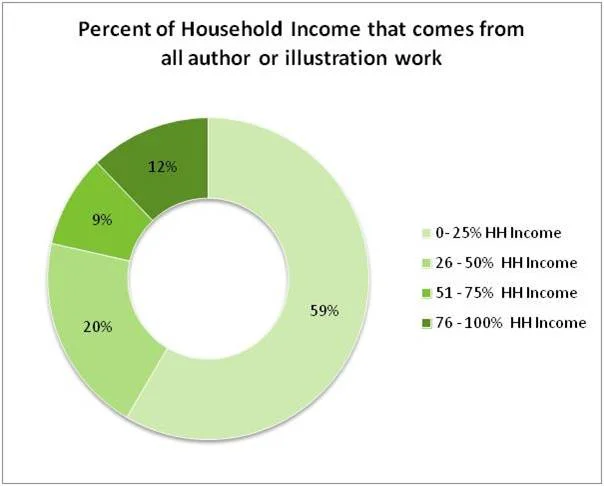
The majority of survey respondents earn less than a quarter of their household income from their work as authors and/or illustrators.
Only 21 percent earn more than half of their household income from their author/illustrator work.
One respondent commented: “Your 0-25 percent choice is misleading. I'm still a negative sink on my family.” Since we did not ask this specific question, we do not know if other respondents might have said the same thing.
Now, on to what you all want to know: how many school visits are we doing? What are we earning?
Overall, respondents did 4,540 school visits in the last year!
The average number of visits per respondent was 10.
The average day rate (among the 92% of respondents who charged for visits) was $1,002.
See our future posts in this series for more details regarding pricing by career stage, location, and more! We expect the second post to go up on Friday and to be followed by two more posts next week that dig deeper into the data. (To be sure you receive them, you can subscribe to my blog on the side bar).
About the authors of this study
We (Jeanette Bradley and Michelle Cusolito) volunteered our time and expertise to bring you the results of this survey. We’d appreciate any support can offer in return. Perhaps you could buy our books (or rather, pre-order Michelle’s), request them from the library, tweet about them, or write a review if you’ve read them and enjoyed them. Thank you for considering.
Jeanette Bradley has been an urban planner, an apprentice pastry chef, and the artist-in-residence for a traveling art museum on a train. (Yes, she is a data nerd who can draw.) Her debut picture book LOVE, MAMA was published by Macmillan/Roaring Brook Press. It contains no cities, pastries, or trains, but was made with lots of love. She currently lives in Rhode Island with her wife and kids. Jeanette is represented by Emily Mitchell of Wernick & Pratt.


You’ve landed on Michelle’s blog/website, so you can poke around to learn more about her. In case you missed it, here’s the cover of Flying Deep, which comes out May 22nd.
